Intelligent Routing
8-Signal Scoring Engine
Every request is scored across eight signals to find the optimal node. This isn't round-robin or random selection, it's a weighted decision that considers the physical reality of each device. The eighth signal is the one you feel: a follow-up message goes back to the machine that already holds that conversation, so it doesn't re-read the whole history first. Check the X-Fleet-Affinity response header to see it happen.
| Signal | What It Measures |
|---|---|
| Model warmth | A model already loaded in memory (hot) gets +50 points. Cold-loading a 40GB model takes 15–30 seconds, the router avoids it whenever possible. |
| Memory fit | Not just "is there enough RAM?" but how comfortably the model fits given current utilization and the node's dynamic memory ceiling. Measured against system RAM, not GPU VRAM. |
| Queue depth | A hot model on a saturated node loses to a warm model on an empty node. Load spreads naturally. |
| Estimated wait time | Uses real per-node, per-model latency history (p75) to estimate actual wait time. A queue of 3 on a fast model differs from a queue of 3 on a slow one. |
| Role affinity | Large models route to powerful machines. Small models route to lighter hardware, preserving big-machine capacity. |
| Availability trend | Is this device freeing up or getting busier right now? Keeps long requests off a machine whose owner just got busy. Only for nodes with capacity learning turned on (opt-in). |
| Context fit | Can this node handle the requested context size without triggering a model reload? |
| Session affinity | Did this node serve the previous turn of this conversation? Follow-up turns go back to it, so it can reuse the history it already processed instead of re-reading all of it on another machine. |
Model Fallbacks
Clients can specify backup models. If the primary model isn't available anywhere in the fleet, the router tries alternatives in order, same scoring pipeline, just a different model.
Auto-Retry
If a node fails before the first response chunk is sent, the router re-scores the remaining nodes and retries on the next-best option. Up to 2 retries. Clients never see the failure.
Context Protection
Strips unnecessary num_ctx from requests to prevent Ollama model reload hangs. Auto-upgrades to a larger loaded model in the same category when the requested model is cold but a compatible one is hot.
Thinking Model Support
Auto-detects chain-of-thought models (DeepSeek-R1, QwQ, Phi-4-Reasoning, GPT-OSS) and inflates num_predict by 4× to accommodate thinking tokens. Diagnostic headers (X-Thinking-Tokens, X-Output-Tokens, X-Budget-Used, X-Done-Reason) let clients see exactly how the token budget was spent.
Device-Aware Scoring (v0.6.0)
Every node's chip and memory bandwidth flow through the heartbeat into the scoring pipeline. Role affinity scales continuously with bandwidth instead of flat memory tiers. For a model over 20 GB, an M3 Ultra (819 GB/s in Herd's table) scores +25, the cap, which any chip reaches at 800 GB/s; an M4 Max at 546 GB/s scores +18.65; an M3 Pro at 150 GB/s scores +8.75. Mid-size models (8 to 20 GB) get 60% of that, and models under 8 GB invert it, so smaller, slower machines score higher for them and the fast machine stays free for heavy work. Queue-depth penalty normalizes by each node's bandwidth share of the fleet median, so a queue of 4 on a 4×-faster node is treated like a queue of 1. Expected steady-state load distribution equals each node's bandwidth share of the fleet total.
Bandwidth comes from a lookup table: Apple Silicon chips, plus a handful of NVIDIA cards when a Linux node reports one. Hardware the table doesn't know falls back to memory tiers. Herd does not read GPU utilization or VRAM; memory fit uses system RAM, so on a machine with a discrete GPU, choose models that fit the card.

Smart Benchmark
Multimodal Benchmark Suite
Benchmark your entire fleet across all five model types, LLMs, embeddings, image generation, speech-to-text, and vision, in a single run. Smart mode auto-discovers fleet capabilities and selects an optimal model mix to fill available memory.
Two Benchmark Modes
Default mode benchmarks whatever models are currently loaded, quick sanity check. Smart mode analyzes fleet hardware, pulls recommended models, and runs a comprehensive benchmark that fills available memory with an optimal mix. Duration, concurrency, and model types are all configurable.
Per-Model and Per-Node Charts
Four new benchmark visualizations: per-model latency and throughput, per-model success rates, per-node concurrency utilization, and an overall timeline. Results persist in SQLite, compare runs over time.
Dynamic Context Optimization
Context Usage Tracking
Every request's actual token usage (prompt + completion) is tracked. The context optimizer computes p50, p75, p95, p99, and max distributions per model, revealing that most models use under 5% of their allocated context window.
Automatic Right-Sizing
Three-phase optimization: observe actual usage, recommend optimal context sizes, then auto-adjust. A model allocated 131K context but using only 5K at p99? Herd recommends 16K, freeing KV-cache memory (50GB+ in that case) that can be used to load additional models.
Context Usage API
The /dashboard/api/context-usage endpoint shows per-model utilization percentage, recommended context size, and potential memory savings. The health engine warns when allocated context exceeds actual usage by 4× or more.
Zero-Config Discovery
mDNS Auto-Discovery
Run herd-node on any Mac, Linux, or Windows machine on the same network. It finds the router automatically via mDNS (Bonjour/Avahi). No IP addresses to configure, no config files to maintain, no DNS entries to manage.
Heartbeat-Based Health
Each node sends heartbeats every 5 seconds with full system state: CPU, memory, memory pressure (macOS and Linux), CPU temperature where the OS exposes it (Linux, some Windows machines), loaded models, disk space, Ollama version. The router knows the state of every device in real time.
LAN Proxy
The node agent automatically bridges LAN traffic to localhost Ollama. Other devices can reach each node's Ollama through the fleet without manual port forwarding.
Adaptive Learning
Capacity learning is opt-in per node (herd-node --learn-capacity), meant for machines people also use for work. Meeting detection and app fingerprinting run as part of it.
Capacity Learner
A 168-slot behavioral model (one slot per hour of the week) learns each device's availability patterns. After a few weeks, the router knows your laptop is busy Tuesday mornings and the Linux server in the closet is always available. Routing decisions reflect these patterns.
Meeting Detection (macOS)
Detects active cameras and microphones and hard-pauses the node. No inference competes with your video calls. The node resumes automatically when the meeting ends.
App Fingerprinting (all platforms)
Classifies the current workload on each device (idle / light / moderate / heavy / intensive) using CPU, memory, and network patterns, without reading app names or window titles. Heavy workloads reduce the node's memory ceiling, shifting requests to other machines.
Latency Tables
Per-node, per-model response times tracked in SQLite. The scoring engine uses historical latency to estimate wait times accurately. A node that's consistently slow for a particular model gradually gets fewer requests for that model.
Queue Management
Per Node:Model Queues
Each node+model pair has its own queue with dynamic concurrency. The router knows how many parallel requests each device can handle without degrading performance.
Holding Queue
When no node can take a request right now (every candidate is offline, paused, under memory pressure, or short on free memory), it waits in a holding queue instead of failing. The router rescores it every 2 seconds for up to 30 seconds as node states change.
Pre-Warming
When a primary node's queue gets deep, the router proactively loads the same model on the runner-up node. The next request hits a hot model instead of waiting.
Background Rebalancer
Runs every 5 seconds, moving queued requests from overloaded nodes to nodes with spare capacity, but only where the model is already loaded.
Zombie Reaper
Detects and cleans up stuck in-flight requests that never completed. Keeps queues accurate.
Backends
Ollama, the default runtime
Every node that runs herd-node needs Ollama, on macOS, Linux, or Windows, with whatever acceleration Ollama uses there (Metal on Apple Silicon, CUDA on NVIDIA). The router speaks Ollama's native API for chat, embeddings, model pulling, and lifecycle management. All mainstream GGUF models work out of the box, Gemma, Qwen, DeepSeek, Llama, Phi, GPT-OSS, hundreds more.
MLX, first-class alongside Ollama (Apple Silicon) (v0.6.0)
Apple Silicon nodes can optionally spawn one or more mlx_lm.server processes alongside Ollama. Useful for MLX-specific models (Qwen3-Coder-Next MoE, Qwen3-Coder-30B-A3B-Instruct) and for running a dedicated compactor model side-by-side with the main coding model without Ollama eviction risk.
Multi-MLX-Server per Node (Apple Silicon) (v0.6.0)
Configure N MLX servers on N ports via FLEET_NODE_MLX_SERVERS. Each runs in its own process with independent logs. Memory-pressure startup gate estimates weight size from the HuggingFace disk cache and refuses to spawn when the total (model + headroom) won't fit, surfaces the skip reason on the dashboard instead of failing silently.
Multi-Node MLX Aggregation (Apple Silicon) (v0.6.0)
Set FLEET_NODE_MLX_BIND_HOST=0.0.0.0 to expose MLX servers on the LAN. The router walks every online node and routes each MLX request to a healthy server hosting the requested model. Per-URL httpx.AsyncClient cache isolation prevents a slow server from back-pressuring a fast one.
Native Text Embedding Server (v0.7.0)
A dedicated FastAPI server on port 11439 runs nomic-embed-text via fastembed + ONNX Runtime, no PyTorch, no Ollama. The router intercepts /api/embed calls for nomic-embed-text before they reach Ollama and proxies to the best node's text embedding server. Zero contention with LLM inference slots, the structural fix for an embed-timeout incident where a running 120B inference held both Ollama parallel slots and embedding requests queued indefinitely despite 14% CPU and 291 GB free RAM. Weights download automatically on first request (130 MB Q-quantized int8) and cache in ~/.fleet-manager/models/text-embedding/. Enable via uv sync --extra embedding, same flag that enables vision embeddings.
Vision Embedding Service
A separate vision-embedding service exposes DINOv2, SigLIP2, and CLIP via ONNX Runtime, so it is not tied to one platform. The dashboard shows availability per node and the health engine fires vision_backend_missing when weights are cached on disk but onnxruntime isn't loadable, closes the "chip says available but /embed-image returns 500" footgun.
Multimodal Support
LLM Inference
Full support for chat completions and text generation. Both streaming and non-streaming. OpenAI and Ollama API formats.
Embeddings
Route embedding requests to the node with the embedding model loaded. Supports /api/embed and /api/embeddings (Ollama format). nomic-embed-text is intercepted before reaching Ollama and routed to the dedicated native fastembed server (port 11439) for zero-LLM-contention embedding traffic. Other embedding models still route to Ollama as a fallback.
Image Generation
Routes image generation requests to Apple Silicon nodes running mflux (FLUX models) or DiffusionKit (Stable Diffusion 3 and 3.5). Ollama's native image models (experimental in Ollama) go through the normal Ollama path instead, so they are not tied to Apple Silicon. OpenAI-compatible /v1/images/generations endpoint included.
Speech-to-Text
Routes transcription requests to nodes with MLX and Qwen3-ASR installed. Apple Silicon only.
Model Pulling
Pull models onto fleet nodes through the router. Auto-selects the node with the most available memory, or target a specific node. Streams progress in real time.
Real-Time Dashboard
A web dashboard at /dashboard with eight tabs:
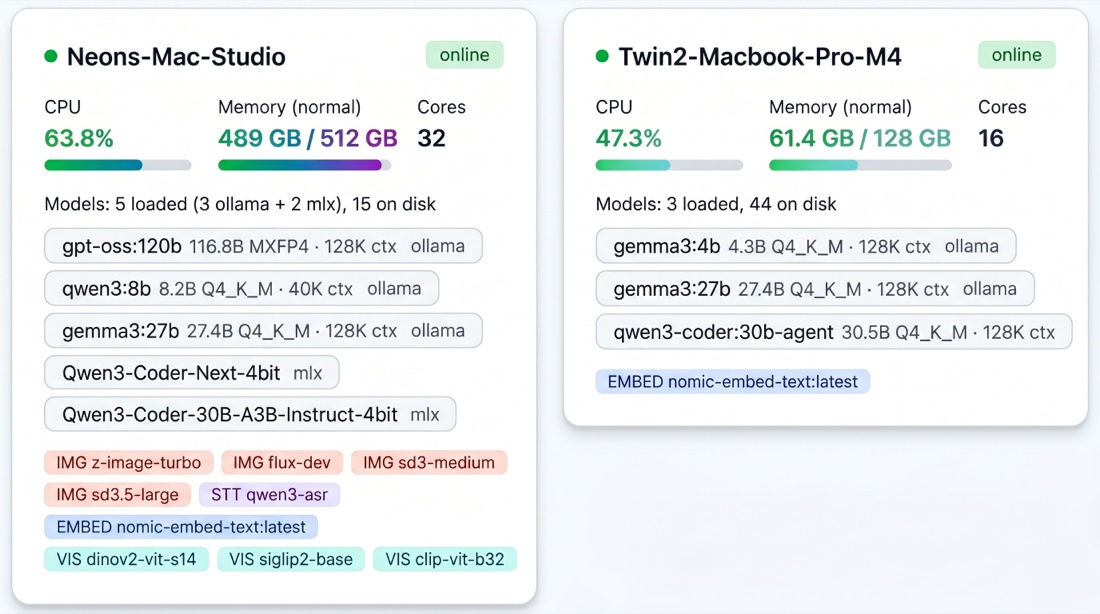
- Fleet Overview, Live node cards, queue depths, and request counts via Server-Sent Events, plus per-model Node Models cards (renamed from "Request Queues" in v0.7.0) for every backend, Ollama (grey), MLX (purple), native fastembed (green), vision embedding (cyan), with 24h completed/failed counts and avg latency, and an amber "DL ON DEMAND" chip for models whose weights aren't yet cached.
- Trends, Requests per hour, average latency, token throughput charts (24h–7d)
- Model Insights, Per-model latency, tokens/sec, usage comparison
- Tags, Per-tag analytics with request volume, latency, tokens, error rates
- Benchmarks, Capacity growth over time with per-run throughput and latency percentiles
- Health, 30+ automated health checks with severity levels including context waste detection, MLX server monitoring, vision-backend availability, and text-embedding backend health
- Recommendations, AI-powered model mix recommendations per node
- Settings, Runtime toggles, config overview, node version tracking
No external dependencies. No build process. Opens in any browser.
Health Monitoring
30+ Automated Health Checks
The health engine continuously monitors fleet liveness, routing quality, backend reliability, and observability. Each check carries a severity (INFO / WARNING / CRITICAL) and an actionable recommendation. Highlights:
| Category | What it catches |
|---|---|
| Fleet liveness | Offline nodes, degraded nodes, memory pressure (OS-reported, not just %), underutilized nodes |
| Routing quality | VRAM fallbacks (cross-category escalates to ERROR with QUALITY RISK note), model thrashing, request timeouts, retry rates, context waste detection |
| MLX backend | Server down (CRITICAL), server quarantined (crash-loop containment after 5 crashes/5min), memory-blocked (skipped start due to memory gate) |
| Text embedding backend | Embed error rate (WARN at ≥5/hr, CRIT at ≥25/hr), text-embedding backend missing (nomic weights cached but fastembed not installed), text-embedding Ollama bypass (native server not running so embed requests still contend for LLM inference slots), nomic still loaded in Ollama despite native server handling traffic (VRAM waste signal) |
| Vision backend | Backend missing (weights cached but onnxruntime not loadable), closes the "chip says available but /embed-image returns 500" footgun |
| Observability | Trace-store write failures (closes a silent SQLite-contention black hole), version mismatch, KV-cache bloat, zombie reaper activity |
| Stream + client integrity | Client disconnects, incomplete streams, context protection events |
Each check has a severity level and actionable recommendation. Available via the dashboard and the /dashboard/api/health endpoint.
API Compatibility
OpenAI Format
| Endpoint | Purpose |
|---|---|
POST /v1/chat/completions | Chat completions (streaming + non-streaming) |
GET /v1/models | List available models |
POST /v1/responses | OpenAI Responses API, used by Codex CLI and the Codex desktop app. Stateless (no previous_response_id) and served by Ollama-backed models only; see the Codex guide |
POST /v1/images/generations | Generate images |
Ollama Format
| Endpoint | Purpose |
|---|---|
POST /api/chat | Chat completions |
POST /api/generate | Text generation |
POST /api/pull | Pull models onto fleet nodes |
GET /api/tags | List all models |
GET /api/ps | List loaded models |
POST /api/embed | Generate embeddings |
POST /api/embeddings | Generate embeddings (alternative) |
Anthropic Messages Format (v0.6.0)
Point Claude Code CLI at your herd with one env var: ANTHROPIC_BASE_URL=http://localhost:11435. The router translates Anthropic Messages ↔ Ollama format transparently, including tool-use, streaming SSE events, and count_tokens. No LiteLLM sidecar.
| Endpoint | Purpose |
|---|---|
POST /v1/messages | Anthropic Messages API (streaming + non-streaming) |
POST /v1/messages/count_tokens | Token budget pre-flight (tiktoken estimate) |
See the Claude Code integration guide for model mapping, tier routing (claude-haiku-* vs claude-sonnet-* / claude-opus-*), and the four stability knobs for long sessions.
Claude Code Reliability Layer (v0.6.0)
Three-Layer Context Management
Mirrors hosted Claude's behavior so local Qwen3-Coder sessions don't fall apart past 30K tokens.
- Layer 1, mechanical tool-result clearing. When the Anthropic request exceeds
FLEET_ANTHROPIC_AUTO_CLEAR_TOOL_USES_TRIGGER_TOKENS(default 100K), oldertool_resultblocks are replaced with a short placeholder before the request reaches the model. No LLM call, microsecond-scale. Real Claude Code session verified: first fire reclaimed 81K tokens (206K → 125K, a 39% reduction). - Layer 2, LLM-based compactor with dynamic curator selection. Off by default (
FLEET_CONTEXT_COMPACTION_ENABLED=trueturns it on). Once the prompt passesFLEET_CONTEXT_COMPACTION_BUDGET_TOKENS(default 20K), it summarizes bulkytool_resultblocks; if the prompt is still over 150K after Layer 1, it summarizes every one of them. If no capable model is free, it passes the request through unchanged. Summary work goes to whatever capable model is already hot and idle rather than cold-loading a default. Cache key deliberately excludescurator_modelso MLX prefix-cache bytes stay stable across curator-selection events. - Layer 3, pre-inference 413 cap. If the prompt is still over
FLEET_ANTHROPIC_MAX_PROMPT_TOKENS(default 180K) after clearing + compaction, the route returns HTTP 413 with arun /compact and resubmitmessage before the request reaches the model, no multi-minute MLX prefill wedge.
Tool-Schema Fixup
Claude Code's 27-tool schema has heavy optional-param usage (Grep has 13 optional params); llama.cpp#20164 documents that Qwen3-Coder starts silently dropping optional params at ~30K tokens and loops tool calls with a field consistently missing. Herd promotes optional params with known-safe defaults (Bash.timeout=120000, Grep.head_limit=250, Read.offset=0) to required-with-default in the outbound schema.
Tool-Call JSON Repair
Local coding models occasionally emit tool_use.input with minor syntax errors. A repair cascade tries strict parse → json-repair → a 4-pattern regex catalog adapted from open-source proxies → pass-through. Every repair attempt is schema-validated before substitution, never hides real failures silently. Per-model repair counters exposed on /fleet/queue. Repair runs on MLX-served models (Apple Silicon); Ollama-served models use Ollama's own tool-call parsing.
MLX Wall-Clock Timeout
FLEET_MLX_WALL_CLOCK_TIMEOUT_S (default 300s) catches wedged-request syndrome where mlx_lm.server keeps emitting tokens slowly but never stops. On timeout, the slot is released and the route returns 413 with the /compact hint. No silent server-side retry, client owns the decision of whether to resubmit.
Warm-Prompt Preload
After mlx_lm.server passes its health check, a fire-and-forget 1-token request primes the prompt cache with the system-prompt prefix. Based on measured 1.3–2.25× TTFT improvement on the first real request.
Fleet Management
| Endpoint | Purpose |
|---|---|
GET /fleet/status | Full fleet state |
GET /fleet/queue | Lightweight queue depths |
Works with Open WebUI, LangChain, CrewAI, AutoGen, Aider, Continue.dev, LlamaIndex, LiteLLM, and any OpenAI-compatible client. Just change the base URL.
Request Tagging
Tag requests with an app identifier to get per-tag analytics. Add X-Herd-Tags: my-app to any request and the dashboard breaks down usage by app, request volume, latency, tokens, error rates. See which tools consume the most fleet resources.
Platform Support
| Feature | macOS | Linux | Windows |
|---|---|---|---|
| LLM routing, scoring, queues | Yes | Yes | Yes |
| Embeddings | Yes | Yes | Yes |
| mDNS auto-discovery | Yes | Yes | Yes |
| Dashboard & traces | Yes | Yes | Yes |
| OpenAI, Ollama, Anthropic Messages, Responses APIs | Yes | Yes | Yes |
| Tool-schema fixup, context management (router-side) | Yes | Yes | Yes |
| Tool-call JSON repair (MLX models) | Apple Silicon | – | – |
| MLX backend | Apple Silicon | – | – |
| Image gen (mflux, DiffusionKit) | Apple Silicon | – | – |
| Image gen (Ollama native) | Yes | Yes | Yes |
| Speech-to-text (MLX) | Apple Silicon | – | – |
| Meeting detection | Yes | – | – |
| Memory pressure detection | Yes | Yes | – |
Core routing works identically on all platforms, with or without an NVIDIA GPU. Apple Silicon and macOS-only features degrade gracefully on other machines: a Linux or Windows node simply doesn't advertise them, and the router sends those requests to a Mac that does.
Configuration
All settings via environment variables with FLEET_ prefix (server) or FLEET_NODE_ prefix (node). 44+ configuration options covering scoring weights, queue behavior, retry limits, heartbeat intervals, and more. Sensible defaults mean you don't need to touch any of them to get started.
See How We Compare
Honest, detailed comparisons with feature tables, pros/cons, and when to choose each tool:
- Ollama Herd vs Single Ollama, when to upgrade from one machine
- Ollama Herd vs exo, fleet routing vs model sharding
- Ollama Herd vs vLLM, mixed-fleet router vs GPU serving engine
- Ollama Herd vs Open WebUI, routing engine vs chat interface
- Ollama Herd vs Cloud APIs, local fleet vs per-token pricing
- Ollama Herd vs NVIDIA PAIR, network-wide fleet router vs NVIDIA's peer-to-peer PC cluster
- View all 20 comparisons →